
Botswana has been one of the role models for economic development despite unfavourable geographic conditions (landlocked, tropical climate) since it gained independence from Britain in 1965. Its success story can be attributed to both its natural resource endowments and institutional development. Despite colonialization precolonial tribal institutions were able to endure. These existing institutional structures encouraged the enforcement of property rights and limited the power of political elites in the country upon independence. It also enabled the development of sound political and economic institutions compared to other countries in sub-Saharan Africa. This is why the country could take advantage of its natural resource endowments. With some minimal requisite institutional development Botswana was able to make the country’ mineral wealth its comparative advantage in international trade. What is more, the government redistributed the gains from the exploitation of national resources by foreign multinationals, i.e. substantial tax revenues from diamond profits, to the population at large. The government invested in human capital formation and in turn achieved universal primary education. With the tax revenues it was also able to establish a basic social security system to avert crises such as the five-year drought from 1982 to 1987 (Todaro & Smith, 2012).
The post of today looks at how Botswana has developed in the 21st century, especially in the aftermath of the global recession 2008/09, and whether it continued its success story. In the first part, it will assess Botswana’s economic development with the use of the Human Development Index (HDI). In the second part, it will look at its governance and institutional development with the use of the World Governance Indicators (WGI).

Botswana currently ranks 106 out of 189 countries in the HDI ranking with an index of 0.698 which is based on the country’s performance in the three dimensions income, education and health (UNDP, 2015a). In the income dimension, the HDI assesses GNI per capita for every country in the index. For Botswana GNI per capita in the 21st century is shown in the diagram above. It highlights that Botswana’s GNI per capita rose steadily by over 4 percent per annum over the period from 2005 to $12,772 in 2008. After a 5.57 percent drop in 2009 due to the global financial crisis it receded to high growth rates. In 2011, GNI per capita growth peaked at 7.62 percent, which catapulted the country’s per capita income above pre-downturn levels. In 2014, GNI per capita stood at $14,661. This is significantly above the average of upper middle income countries (UMC; four-tier World Bank classification) of $13,413 for the year 2014 (World Bank, 2016). However, Botswana has lost ground during the global financial crisis compared to the upper-middle income countries as its peers (as an aggregate group) experienced a significantly smaller drop in per capita income. Overall it can be concluded, though, that Botswana has performed well in the income category due to steady growth rates since 2005 if one excludes the year 2009. Incomes have seen a quite steady upward trend.

Education in the HDI is assessed by expected years of schooling and mean years of schooling. The former has increased from 11.7 years in 2000 to 12.5 years in 2014. The latter has increased from 7.6 to 8.9 over this period (UNDP, 2015b). Hence Botswana’s adult population today (aged 25 and above) has, on average, more than a year more of education than at the beginning of the century. Also government expenditure on education as percentage of GDP remains high and currently sits at 9.5 percent (UNDP, 2016). What is more, after having achieved universal primary education and widespread secondary education in the population, the country is now expanding post-school education as a means to develop human capital to the next level. This will in turn allow for sustained economic development in the future. The diagram above shows that the country’s gross tertiary enrolment ratio for both sexes went up from 6.9 percent in 2000 to 27.5 percent in 2014. The largest increase was seen over the period from 2007 to 2009 with an increase of more than 11.5 percentage points. Due to the crisis, however, it dropped and only picked up after 2011 again. The diagram also reveals that Botswana has caught up with the lower middle income countries (LMC) over the last years. In order to catch up with the UMCs, though, it needs to further invest in tertiary education to aim for enrolment levels close to 40 percent and beyond in the future.

The HDI’s dimension health is assessed through the indicator ‘Life expectancy at birth’. The health dimension has been the problem child of Botswana at the turn of the century due to the HIV/AIDS pandemic. It caused life expectancy to decrease from more than 62 years in 1990 to below 50 years in 2000. In the 2000s, however, Botswana made enormous progress and surpassed its 1990 level of 62.7 years by the end of 2010. It rolled out antiretroviral treatment which is now available free of charge to all citizens (Todaro and Smith, 2012). This allowed Botswana to surpass the low income countries (LIC) average. With its current life expectancy of 64.4 years it is now in the middle of the low income and lower middle income average in life expectancy.
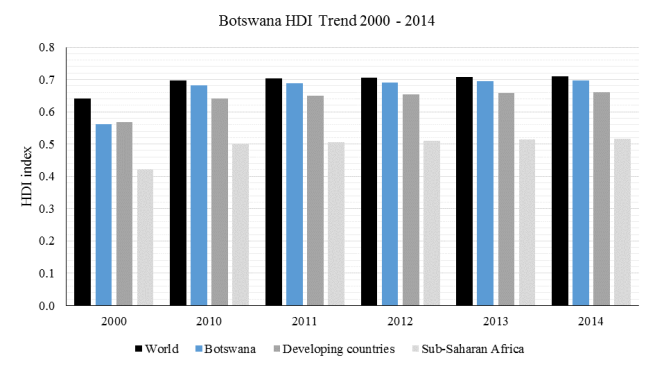
Overall, Botswana has caught up in human development mainly due to the large increase in life expectancy but also due to the steady rise in incomes. While the country’s HDI laid at 0.561 in 2000, it increased to 0.681 by 2010. Furthermore while the annual average HDI growth was actually negative from 1990 to 2000 it went up to 1.96 percent during the period 2000 to 2010. After 2010 it lowered to 0.61 percent on average per annum. In 2000, Botswana’s HDI was below the developing countries average but by 2010 it had surpassed the developing country average. Overall, Botswana’s HDI has also gotten close to the world average; the gap lowered to 0.013 index points in 2014 (UNDP, 2015a).
The second part of the post uses the WGI framework published by the World Bank annually since 2002. The bank developed this six-dimensional framework to assess (I) the process of government selection, monitoring and replacement, (II) the government’s capacity in policy making and implementation as well as (III) the environment for social and economic interaction. Each of these areas includes two governance measures shown in the diagrams below for the case of Botswana (Kaufmann, Kraay, & Mastruzzi, 2010).

In the first area the two indicators are political stability and voice and accountability. Political stability has been extraordinarily high over the complete period. Botswana’s percentile rank has been consistently over 80 since 2006, meaning that 80 percent of the countries included in the WGIs have ranked below Botswana in this dimension in these years. This is due to the fact that the country’s multiparty democracy has been stable with elections every 5 years since 1965 and the success of the government to redistribute the gains from economic growth to the population at large (Todaro and Smith, 2012). Also relatively low corruption and a good human rights record contribute their share to political stability, making it one of the continent’s most stable nations (BBC, 2016). The most important threats to stability are regional dynamics and the high economic dependence on South Africa which can pose a transmission mechanism for economic or political crises. Also Botswana’s narrow economic base with high dependence on diamond tax revenues and the decline of the power of the long-term ruling political party might be potential sources of social instability in the future (Throup, 2011).
The second indicator voice and accountability has seen a fall over the period from 2004 to 2011. This has been the long-term trend despite a 2011 score that was highest of all South African Development Community (SADC) countries, indicating freedom of expression, freedom of association and free media. The downward sloping trend is attributed to the lack of legislation granting freedom of information or ensuring public access to information (OECD, 2014). A Freedom of Information Act was brought on its way in 2010 to improve access to public information but in August 2012 the ruling party opposed this bill so that public access to information remains a concern in Botswana. There have been more incidences of harassment and censorship lately and the government’s press relations have deteriorated since 2008 under the new president Ian Khama. Furthermore state-owned outlets (broadcast media distribution) as well as the state-owned largest newspaper Daily News, which is free to readers and is the only newspaper that covers rural areas, dominate the media market (Freedom House, 2016).

In the second area the indicators are government effectiveness and regulatory quality. The former’s percentile rank has deteriorated since 2007 to 64.9 in 2014. The latter increased over the period from 2008 to 2012 but fell slightly thereafter. In general, government effectiveness has benefited from long-term planning and the government’s sound vision for the economy’s future since independence. The government has targeted broad economic development benefiting the society at large (Todaro and Smith, 2012). Government effectiveness has also been ensured, for example, through the Sustainable Budget Index, which is an implicit self-disciplinary rule that requires the government to invest mineral revenues in development and health and education (Iimi, 2006). These observations can explain why both indicators are still relatively high. On the other hand, the downward trend in government effectiveness is attributed to the deterioration of the quality of public services, of the civil service, of government policies and implementation capacity (Clausen, Deléchat, and Geartner, 2008). UNDP also points out that the public sector of Botswana has been relatively large in terms of employment and its share in the country’s GDP which in turn has created more opportunities for low effectiveness and inefficiency in the 21st century. The decline can therefore be associated with some wastage of resources in the government systems. Overall, however, UNDP (2009) sees the government’s capacity in policy making and implementation, e.g. poverty reduction and environmental programmes and HIV/AIDS projects, as solid and relevant after the turn of the century. Overall government effectiveness will be a key determinant of Botswana’s institutional strength in the future. The government’s effectiveness is currently below the standards of upper-middle income countries which Botswana is part of. It will need to improve its delivery of social outcomes (health and education) to catch up (Moody’s, 2015).

In the third area the two indicators are control of corruption and rule of law. Both indicators are requisites for markets to function properly and to shape incentives for actors to engage in economic activities. They also allow society to function smoothly. Both indicators have been relatively high over the complete period from 2000. In 2014, more than 70 percent of the countries ranked below Botswana in terms of controlling corruption and the rule of law. However, the former has seen a decline from 2013 to 2014 while the latter improved over that time. Overall, the indicators have remained relatively stable, positioning Botswana well above the average. Botswana has also long been the top performer in the rule of law compared to the other African countries (The Economist, 2015). One of the current legal issues is access to justice for minorities infected or affected by HIV/AIDS as legislation is not currently promoting human rights in these regards (UNDP, 2013).
In summary, the post looked at both Botswana’s economic development with the use of the HDI and the country’s institutional development in the 21st century, supplemented by World Bank statistics. Botswana has made enormous progress in terms of economic development, especially in national incomes and health (life expectancy). The 2008/09 recession did have a significant impact on the country’s development though. Its income and education outcomes for example took a hit. However, the country’s HDI still grew rapidly over the period from 2000 to 2010 as a whole after negative growth in the decade before. It also grew moderately after 2010. Overall, Botswana caught up and lowered the gap between its HDI and the world average remarkably by 2014. In terms of economic development Botswana therefore arguably has continued to be a success story. In terms of the country’s institutional development, it can be noted that it has ranked above average in all 6 dimensions even at the beginning of the century but one could observe deterioration of conditions in some areas since the 2000s. Key areas of concern are now voice and accountability with the need for freedom of information as well as a return to higher government effectiveness. Also the most recent drop in the control of corruption needs to be monitored closely. Progress has been made in the rule of law in international comparison recently and in regulatory quality from 2008 to 2012. Botswana’s strongest area remains its political stability. Ultimately, high long-term stability has enabled Botswana’s progress after independence in 1965 and it continues to be the driver, for example, for foreign investment as investors seek high returns coupled with low risk and politically stable economies. This has been and continues to be Botswana’s key to success. Botswana faces more challenges than I could address here but it does provide a short overview on why the country’s success story continues.
Thanks for reading!
Jasse
BBC (2016, 1 February). Botswana country profile [online]. BBC News. Retrieved from: http://www.bbc.com/news/world-africa-13040376
Clausen, J., Deléchat, C., and Geartner, M. (2008). Botswana: Selected Issues (IMF Country Report No. 08/57). Washington, D.C.: International Monetary Fund.
Freedom House (2016). Botswana: Freedom of the Press 2013. Retrieved from: https://freedomhouse.org/report/freedom-press/2013/botswana
Iimi, A. (2006). Did Botswana Excape from the Resource Curse? (IMF Working Paper 06/138) Washington, D.C.: International Monetary Fund.
Kaufmann, D., Kraay, A., & Mastruzzi, M. (2010). The Worldwide Governance Indicators: Methodology and Analytical Issues. Washington, D.C.: Brookings Institute. Retrieved from: http://www.brookings.edu/~/media/research/files/reports/2010/9/wgi-kaufmann/09_wgi_kaufmann.pdf
Moody’s (2015, 11 December). Moody’s affirms Botswana’s A2 government bond rating; outlook stable. Retrieved from: https://www.moodys.com/research/Moodys-affirms-Botswanas-A2-government-bond-rating-outlook-stable–PR_341051
OECD (2014). OECD Investment Policy Reviews: Botswana 2014. Paris: OECD Publishing. Retrieved from: http://dx.doi.org/10.1787/9789264203365-en
Todaro, M.P., and Smith, S.C. (2012). Economic Development (11th ed.). Boston, M.A.: Addison-Wesley.
UNDP (2009). Assessment of Development Results: Evaluation of UNDP Contribution Botswana [pdf]. New York, N.Y.: United Nations Development Programme. Retrieved from: https://www.oecd.org/countries/botswana/46818033.pdf
UNDP (2013). Rule of Law and Access to Justice in Eastern and Southern Africa: Showcasing Innovations and Good Practices [pdf]. Addis Ababa: UNDP Regional Service Centre for Africa. Retrieved from: http://www.bw.undp.org/content/dam/botswana/docs/Gov%20and%20HR/Rule%20of%20Law%20in%20ES%20Africa%202013.pdf
UNDP (2015a). 2015 Human Development Statistical Tables [Data file]. Retrieved from: http://hdr.undp.org/sites/default/files/2015_statistical_annex_tables_all.xls
UNDP (2015b). Human Development Report 2015: Briefing Note Botswana [pdf]. Retrieved from: http://hdr.undp.org/sites/all/themes/hdr_theme/country-notes/BWA.pdf
UNDP (2016). Botswana Human Development Indicators. Retrieved from: http://hdr.undp.org/en/countries/profiles/BWA
The Economist (2015, 3 June). African governance: Law comes first – Botswana is rated best on the continent in rule of law and governance, again [online]. The Economist. Retrieved from: http://www.economist.com/news/middle-east-and-africa/21653584-botswana-comes-top-continent-governance-and-rule-law-again-law-first
Throup, D. (2011). Botswana: Assessing Risks to Stability. Washington, D.C.: Center for Strategic International Studies. Retrieved from: http://csis.org/files/publication/110623_Throup_Botswana_web.pdf
World Bank (2015). World Governance Indicators [Data]. Retrieved from World Governance Indicators (WGI) database: http://data.worldbank.org/data-catalog/worldwide-governance-indicators
World Bank (2016a). World Development Indicators: Botswana [Data file]. Retrieved from: http://api.worldbank.org/v2/en/country/bwa?downloadformat=excel
World Bank (2016b). World Development Indicators [Data]. Retrieved from World Development Indicators (WDI) database: http://databank.worldbank.org/data/reports.aspx?source=world-development-indicators&preview=on
